Client: New York City (NYC) Department of Health and Mental Hygiene (DOHMH)
Heightened awareness of the risks of bioterrorism since 9/11 coupled with a growing concern about naturally emerging and reemerging diseases such as West Nile, severe acute respiratory syndrome (SARS), and pandemic influenza have led public health policymakers to realize the need for early warning systems. “Syndromic surveillance” is a new public health tool intended to fill this need. The theory behind syndromic surveillance is that during an attack or a disease outbreak, people will first develop symptoms, then stay home from work or school, attempt to self-treat with over-the-counter products, and eventually see a physician with nonspecific symptoms days before they are formally diagnosed and reported to the health department. To identify such behaviors, syndromic surveillance systems regularly monitor existing data for sudden changes or anomalies that might signal a disease outbreak.
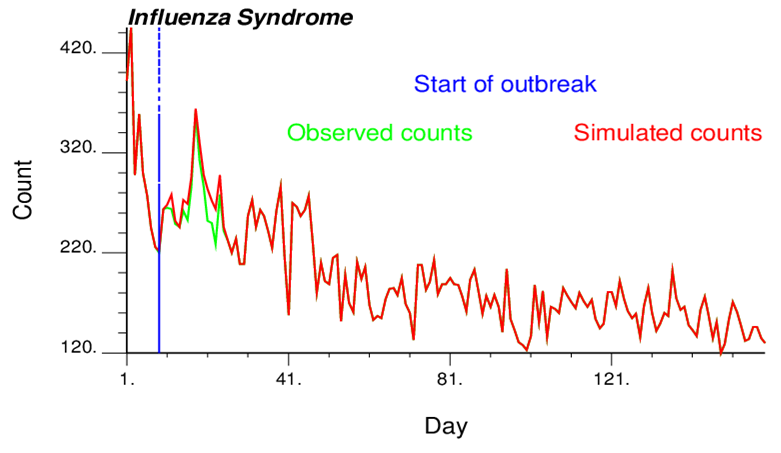
As for all detection techniques, there is a trade-off between sensitivity (the ability to detect an attack when it occurs) and the false-positive rate (the probability of sounding an alarm when there in fact is no attack). The New York City Department of Health and Mental Hygiene was interested in comparing the performance of different syndromic surveillance methods using simulated data. The idea is to “spike” a data stream with a known signal, run detection algorithms as if the data were real, and record whether the signal was detected, and if so, when. This process is repeated multiple times to estimate how the sensitivity—the probability of detection, the false-positive rate, and timeliness—depends on the size, nature, and timing of the signal and other characteristics.
The objectives of this project were:
An approach was developed and implemented into an executable called outbreak-simulation.exe to:
Goovaerts, P. 2013. Outbreak data simulation for syndromic surveillance. Final report. March 8, 2013.