Client: University of Louvain-la-Neuve, Belgium
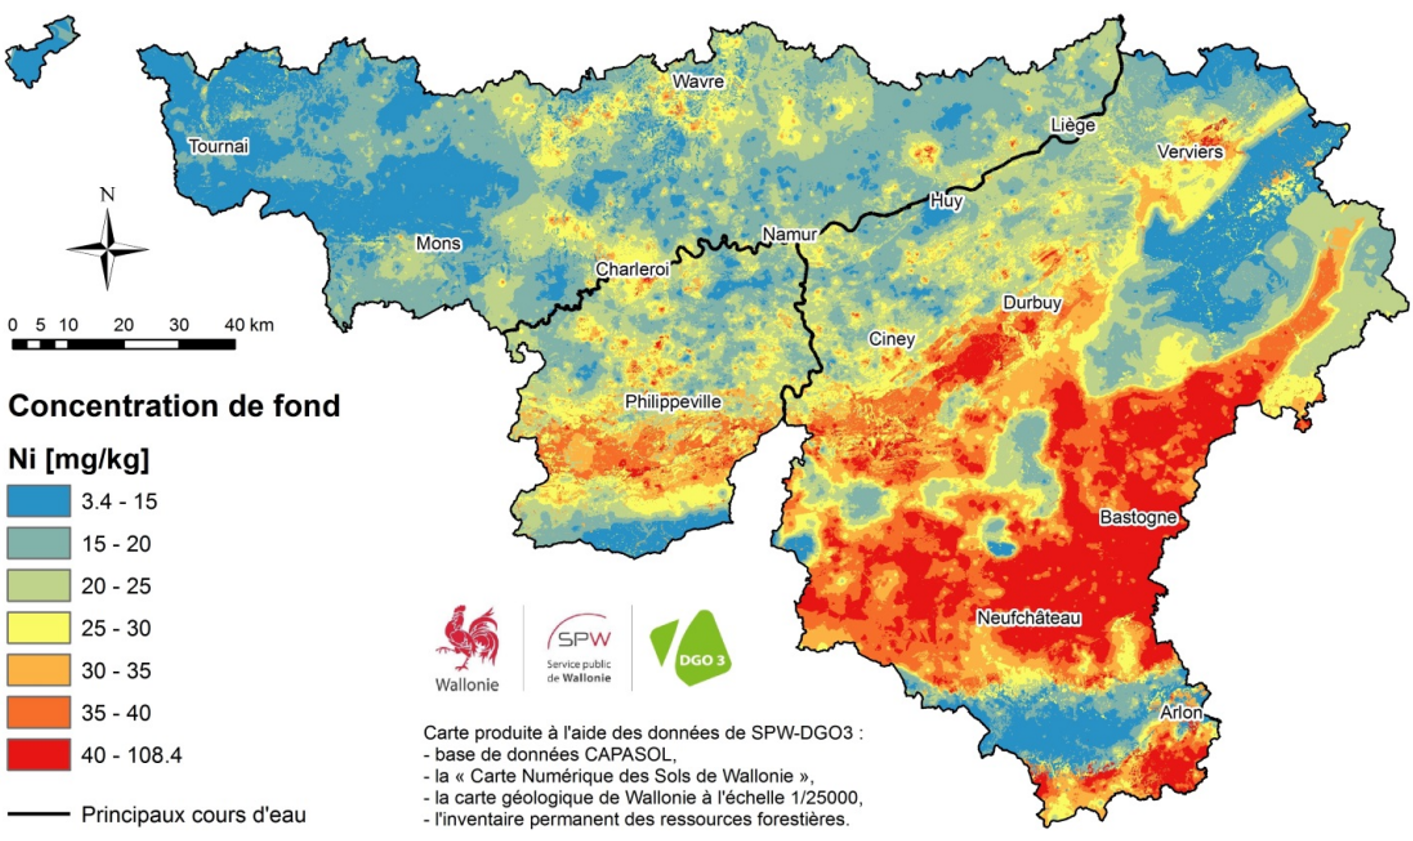
In many countries, government agencies rely on soil maps of trace metal background concentrations to implement soil protection policies. In Wallonia (South Belgium), regional regulation requires extremely detailed background concentration maps. The main obstacle to obtain these maps are the large variations in local background concentrations over short distances, mainly due to the high diversity of soil parent materials, and the atmospheric deposition of pollutants around former base metal smelters.
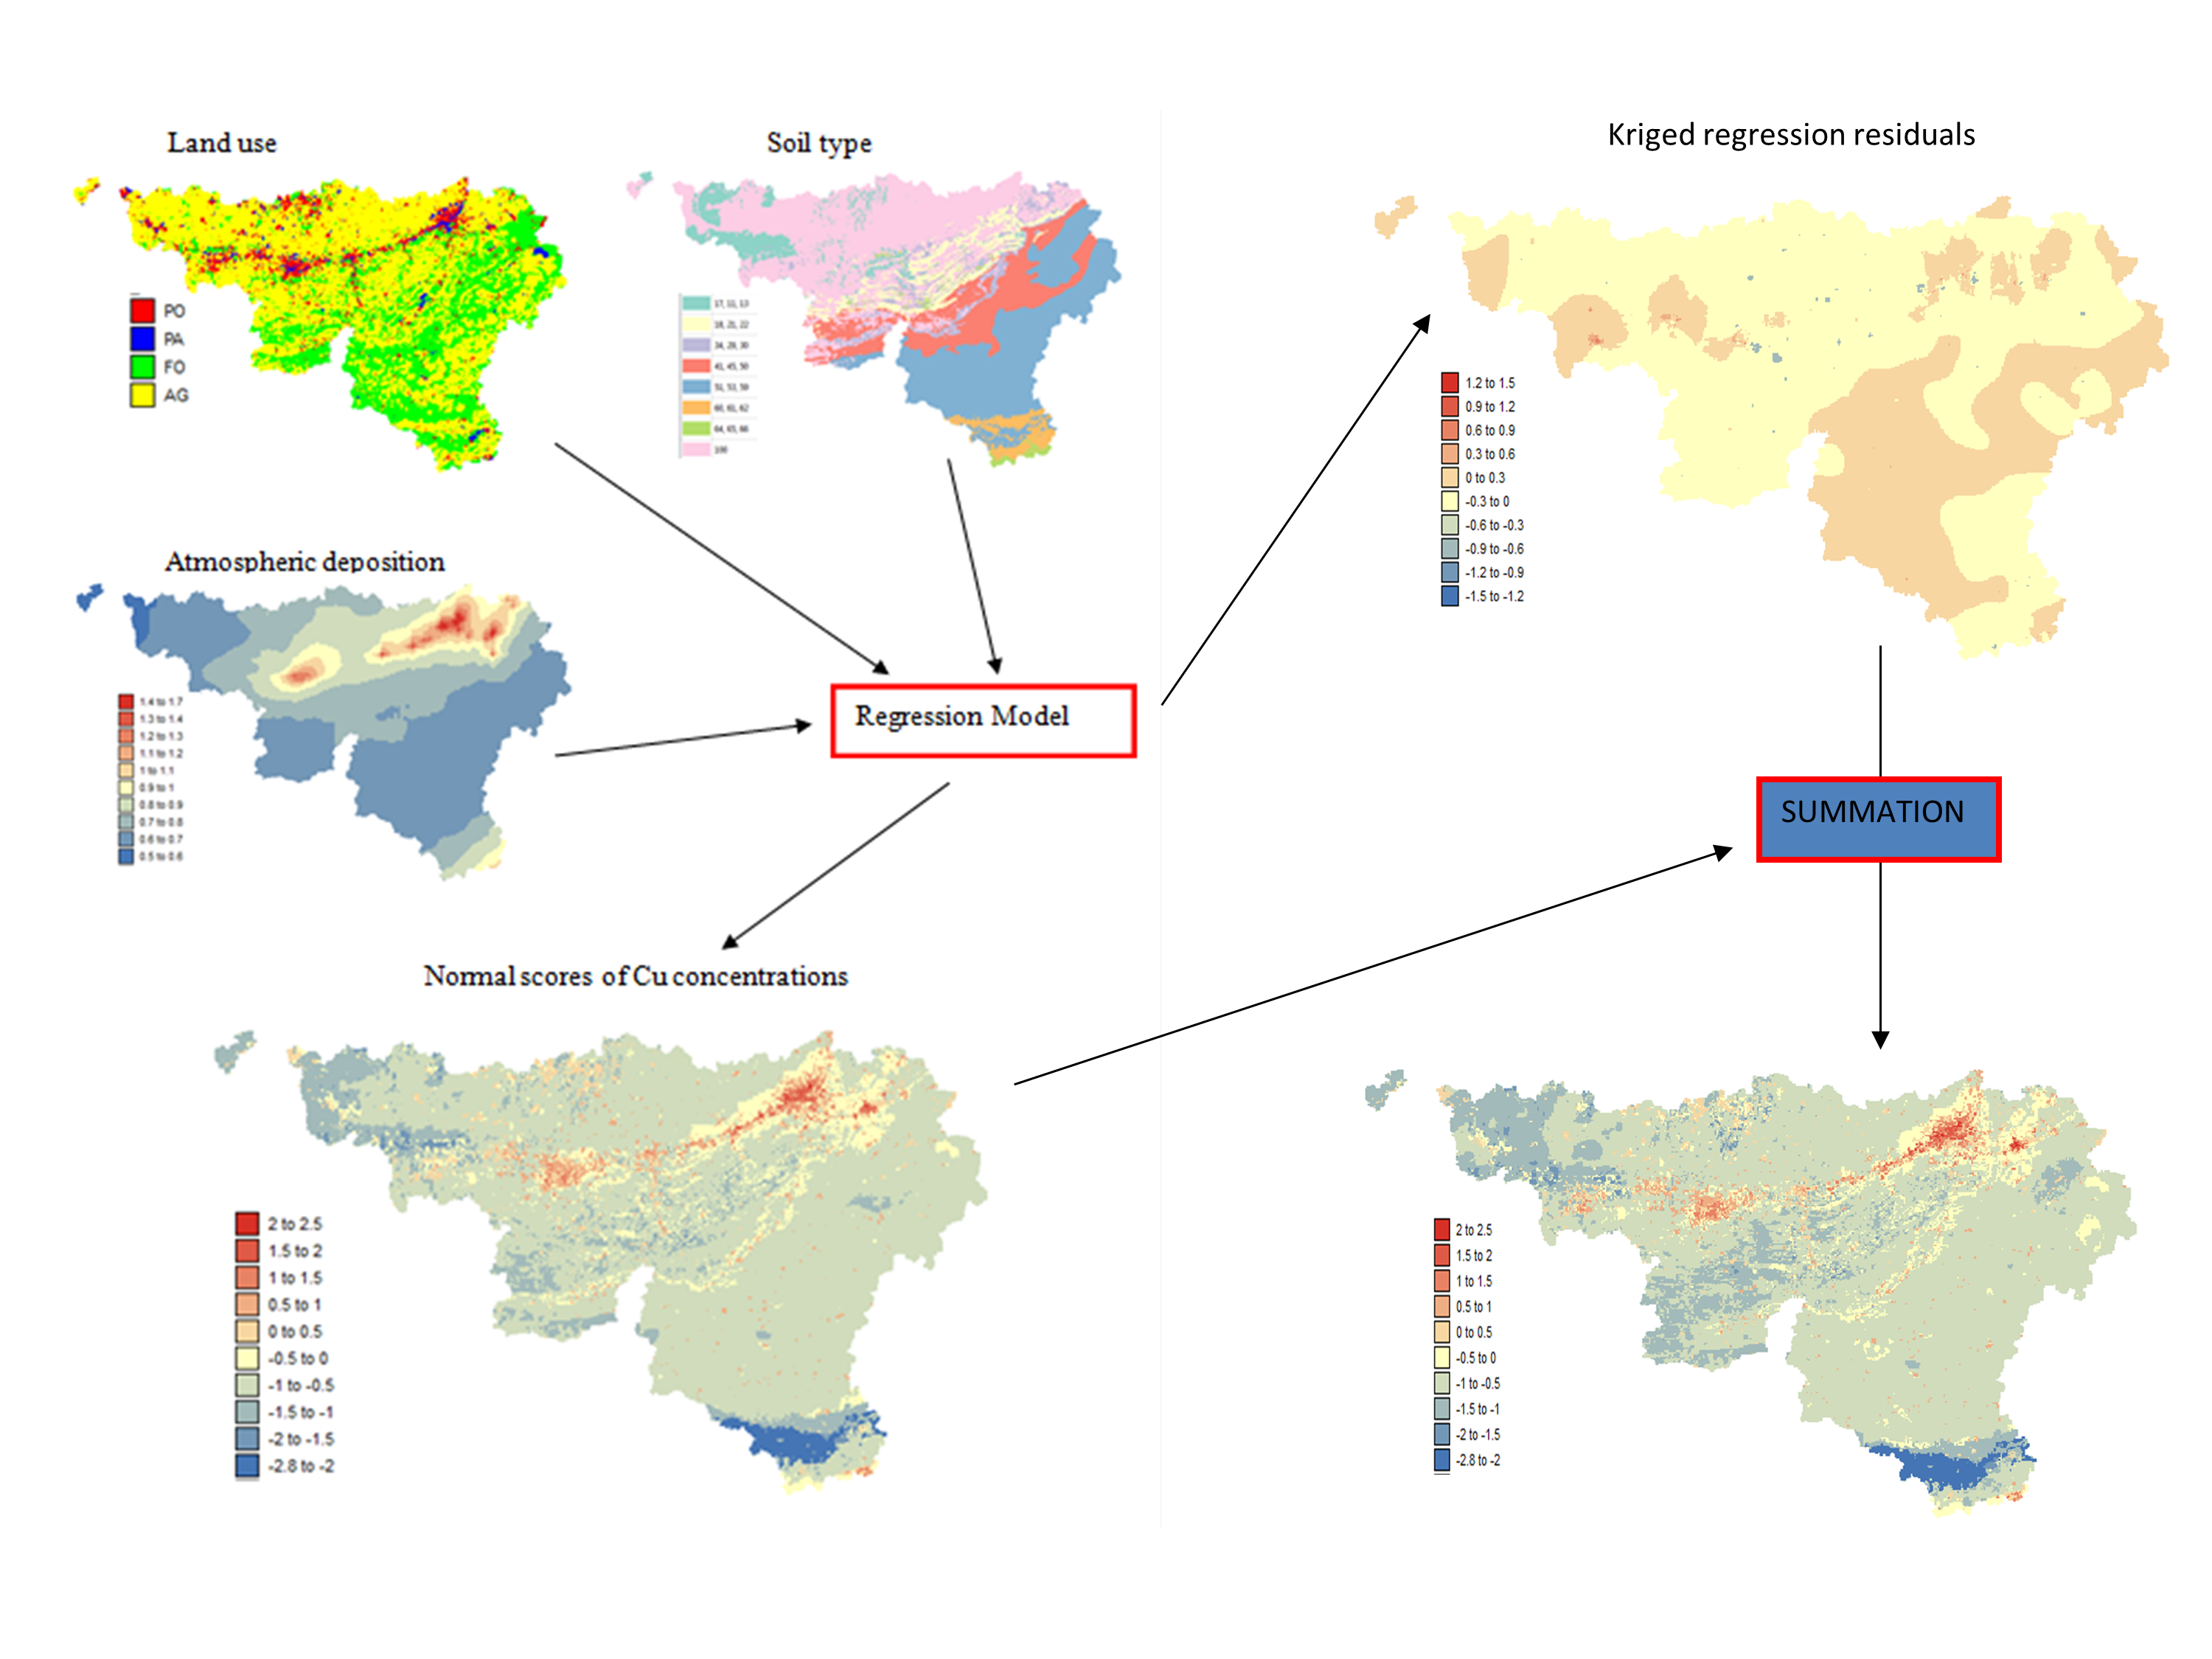
The overall objective of the project was to map the spatial distribution of 43 different soil pollutants (organic and inorganic) over the entire Walloon region (16,844 km2) using data collected during several sampling campaigns, models of atmospheric depositions in urban areas, information on soil type and landuse. My main duties involved the development and application of advanced geostatistical techniques to detect spatial outliers and combine all these sources of information in the high-resolution mapping (500 m spacing) of soil pollution.
Two databases containing georeferenced soil analyzes providing data on soil background concentrations were used for this study: the CAPASOL database (17,000 sampled agricultural soils) and the permanent inventory of woody resources (about 700 sampled forest soils). The methodology used for drawing the maps involves three steps. In the first step, our Belgian collaborators divided Wallonia (17,000 km2) into soil pedogeochemical units based on (1) the soil map of the Wallonia (1:20,000), (2) geological maps (1:40,000 and 1:25,000), and (3) literature data and survey results about soils and geology of Wallonia. In the second 2step, they produced a single reliable dataset by compiling the two available soil databases by a data selection and data leveling method which was designed for this purpose. On the last step, I developed and validated a geostatistical methodology to map the concentrations and the 95th percentile of the local distribution of each soil pollutant (i.e. the concentration that has only a 0.05 probability to be exceeded). The resulting maps reveal large variations in local background concentrations over short distances, mainly due to the high diversity of soil parent materials, and to the atmospheric deposition of pollutants around former base metal smelters. Wallonia has higher Ni background concentration in soil than average values in Europe (according to the values of Geochemical Atlas of Europe), principally because of high geogenic background levels. Also, higher Zn and Cd values are found, principally due to atmospheric deposition of pollutants originating from former base metal smelters.